
The Breaking Bad actor explains below why former President Donald Trump’s slogan ignores the centuries of oppression of Black people in America.
“When I see ‘Make America Great Again,’ my comment is, ‘Do you accept that that could possibly be construed as a racist remark?'” “A lot of people go, ‘How could that be racist, to make America great again?’ I said, ‘So just ask yourself from an African-American experience: When was it ever great in America for the African-American? So if you’re making it great again, it’s not including them.'”
Oh, this is absolutely brilliant, actor Bryan Cranston nails it here with his explanation of why the “Make America Great Again” saying and movement is steeped in racism. This is definitely a must see!????#wtpBlue #DemVoice1 #DemsAct pic.twitter.com/9aBsPyRqR0
— Brian Cardone ????☠️???????? (@cardon_brian) February 27, 2023
Cranston continued, “It’s to teach us, in the ‘woke’ world, to open up and accept the possibilities that our privilege has created blind spots for us. Maybe I haven’t seen what’s really happening, in all my years.”
Cranston obviously has a point. One could also state that it is not just African Americans who have never experienced it. Every ethnic group has never experienced the greatness.
The history of the US, over the last half a century, in terms of inequality is pitiful. Only a very small priviliged group has benefitted. The rest of US history is of course worse but let us focus on the more recent past.
As George Carlin explains:
1. Wage Inequality
Over the last 30 years, wage inequality in the United States has increased substantially, with the overall level of inequality now approaching the extreme level that prevailed prior to the Great Depression. This general characterization of the inequality trend oversimplifies, though, the actual pattern of change: The chart below shows that the trend at the top of the income distribution (the “upper tail”) is not exactly the same as the trend at the bottom of the distribution (the “lower tail”). “Lower-tail” inequality is measured here by taking the ratio of wages at the middle of the income distribution (i.e., the 50th percentile) to those near the bottom of the distribution (i.e., the 10th percentile); “upper-tail” inequality is measured by taking the ratio of wages near the top of the distribution (i.e., the 90th percentile) to those at the middle of the distribution (i.e., the 50th percentile of workers). We find that lower-tail inequality rose sharply in the 1980s and contracted somewhat thereafter, while upper-tail inequality has increased steadily since 1980.
Men’s wage inequality
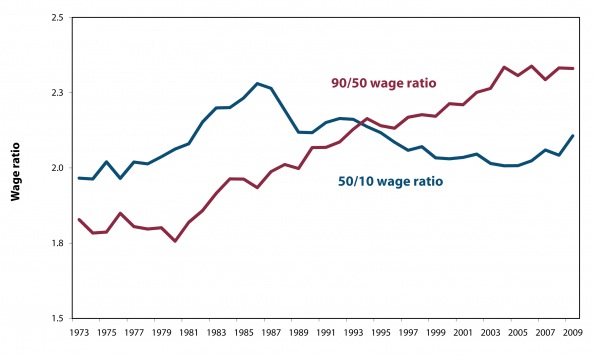
Source: Economic Policy Institute. 2011. “Upper Tail” inequality growing steadily: Men’s wage inequality, 1973-2009. Washington, D.C.: Economic Policy Institute. May 11, 2011. <http://www.stateofworkingamerica.org/charts/view/192>.
2. CEO pay
Recent decades have seen a clear increase in the difference between CEO compensation and that of the average worker in manufacturing or “production.” CEOs in 1965 made 24 times more than the average production worker, whereas in 2009 they made 185 times more. This chart shows how this ratio between the compensation of CEOs and production workers took off in the 1980s.
U.S. CEO pay in relation to the average production worker’s compensation
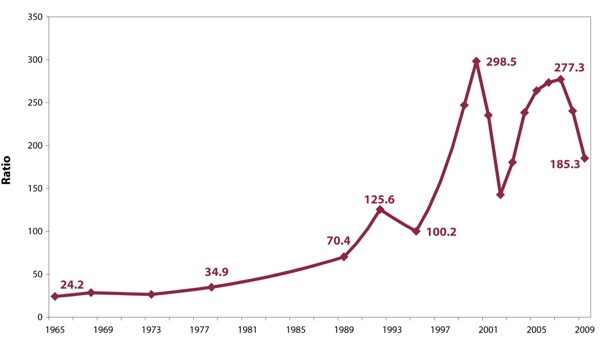
Source: Economic Policy Institute. 2011. More compensation heading to the very top: Ratio of average CEO total direct compensation to average production worker compensation, 1965-2009. Washington, D.C.: Economic Policy Institute. May 16, 2011. <http://www.stateofworkingamerica.org/charts/view/17>.
3. Homelessness
There are 750,000 Americans who are homeless on any given night, with one in five of them considered chronically homeless. The ranks of the sheltered homeless include disproportionate numbers of males, blacks, middle-aged people (i.e., ages 31-50), veterans, and disabled.
Who is Homeless?
Source: U.S. Department of Housing and Urban Development. 2007. The Annual Homeless Assessment Report to Congress. See http://www.huduser.org/Publications/pdf/ahar.pdf.
4. Education Wage Premium
Only college graduates have experienced growth in median weekly earnings since 1979 (in real terms). High school dropouts have, by contrast, seen their real median weekly earnings decline by about 22 percent.
Median weekly earnings of full-time workers (workers 25 years old & older, 2006 dollars)

Source: Bureau of Labor Statistics, Charting the U.S. Labor Market in 2006; see http://www.bls.gov/cps/labor2006/home.htm. Updated to 2009 by Steve Hipple of the Bureau of Labor Statistics; see http://economix.blogs.nytimes.com/2010/05/17/the-value-of-college-2/
5. Gender Pay Gaps
Throughout much of the 20th century, the average woman earned about 60% of what the average man earned. Starting in the late 1970s, there was a substantial increase in women’s relative earnings, with women coming to earn about 80% of what men earned. This historic rise plateaued in 2005 and, since then, the pay gap has remained roughly unchanged.
Women’s earnings as a percent of men’s (full-time wage and salary workers, annual averages)

Source: U.S. Department of Labor, Bureau of Labor Statistics. 2010. Highlights of Women’s Earnings in 2009. Report 1017. See http://www.bls.gov/cps/cpswom2009.pdf.
6. Occupational Sex Segregation
Women and men tend to work in very different occupations. And overall “men’s jobs” are better paid than “women’s jobs.”
Gendered occupations and unequal rewards
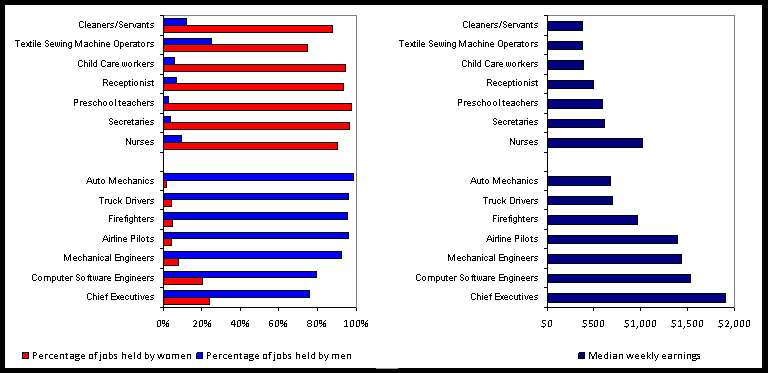
Source: U.S. Department of Labor, Bureau of Labor Statistics. 2009. Highlights of Women’s Earnings in 2008. Report 1017. See http://www.bls.gov/cps/cpswom2008.pdf.
7. Racial Gaps in Education
High-school dropout rates are least among whites and highest among Hispanics, while college enrollment rates are least among blacks and highest among whites. The high-school dropout rate has grown more similar among these three groups, while the college enrollment rate has grown more sharply different.
High school dropout percentage (among persons 16-24 years old) and college enrollment percentage (among high school graduates)
Source: The Digest of Education Statistics 2008, National Center for Education Statistics.
8. Racial Discrimination
Racial discrimination continues to be in the labor market. An experiment carried out in Chicago and Boston during 2001 and 2002 shows that resumes with “white-sounding” names, whether male or female, were much more likely to result in call backs for interviews than were those with “black-sounding” names (even though the resumes were otherwise identical).
Interview call-back rate for women with “white” names and “black” names
Source: Bertrand, Marianne and Sendhil Mullainathan. 2004. “Are Emily and Greg More Employable than Lakisha and Jamal?” American Economic Review 94(4): 991-1013.
9. Child Poverty
In the United States, 21 percent of all children are in poverty, a poverty rate higher than what prevails in virtually all other rich nations.
Relative Poverty Rates in Forty Nations in the Mid-to-Late 2000s
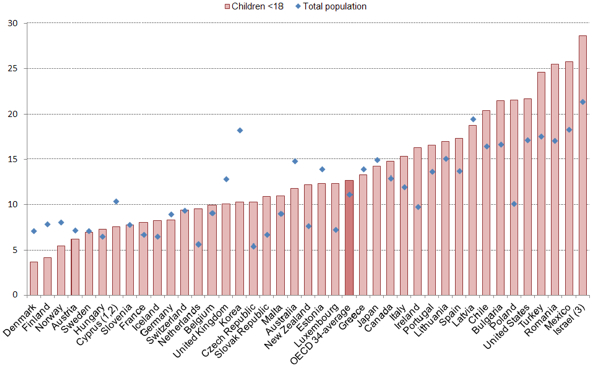
Source: OECD Income Distribution questionnaire, February 2011. Data refer to 2008 for Germany, Israel, Italy, Korea, Mexico, Netherlands, New Zealand, Norway, Sweden and the United States; 2007 for Canada, Denmark and Hungary; 2006 for Chile, Estonia, Japan and Slovenia; 2005 for France, Ireland, Switzerland and the United Kingdom; 2004 for Australia, Austria, Belgium, Czech Republic, Finland, Greece, Iceland, Luxembourg, Poland, Portugal, the Slovak Republic, Spain and Turkey.
10. Residential Segregation
We all know that the rich in the United States tend not to live in the same neighborhoods as the poor. But did you know that such residential segregation is on the rise? The graph below reveals that, between 1970 and 2000, there has been a sizable increase in segregation. We show this result by measuring (a) how likely it is for households in the top fifth of the income distribution to live with households not in the top fifth (in 1970 and 2000), and (b) how likely it is for households in the bottom fifth of the income distribution to live with households not in the bottom fifth (again in 1970 and 2000).
Class-based segregation

Source: Claude S. Fischer, Gretchen Stockmayer, Jon Stiles, Michael Hout. 2004. “Distinguishing the Geographic Levels and Social Dimensions of U.S. Metropolitan Segregation, 1960-2000.” Demography 41(1): 37-59.
11. Health Insurance
In 2007, 8.1 million children under 18 years old were without health insurance. Children in poverty and Hispanic children were more likely to be uninsured.
Uninsured Children by Poverty Status, Age, and Race and Hispanic Origin (percent)

Source: U.S. Census Bureau, Current Population Reports. 2008. Income, Poverty, and Health Insurance Coverage in the United States: 2007. See http://www.census.gov/prod/2008pubs/p60-235.pdf.
12. Intragenerational Income Mobility
Intragenerational income mobility refers to the rate at which a person moves to a higher or lower income level during her or his work career. More than half of those individuals in the bottom income quintile in 1994 remained there 10 years later, and less than 4 percent reached the top quintile.
Relative Mobility Out of the Bottom Income Quintile (individuals age 25 to 44)
Source: Gregory Acs and Seth Zimmerman. 2008. U.S. Intragenerational Economic Mobility From 1984 to 2004. The Urban Institute. See http://www.urban.org/UploadedPDF/1001226_intragenerational_economic_mobi….
13. Bad Jobs
“Bad jobs” are typically considered those that pay low wages and do not include access to health insurance and pension benefits. As shown here, about 10% of full-time workers are in low-wage jobs, about 30% don’t have health insurance, and about 40% don’t have pensions. The graph also shows that the likelihood of being in a bad job is much worse for part-time workers, for on-call and day laborers, and for those working for temporary help agencies.
Employment relations and job characteristics
Source: Arne L. Kalleberg, Barbara F. Reskin, Ken Hudson. 2000. “Bad Jobs in America: Standard and Nonstandard Employment Relations and Job Quality in the United States.” American Sociological Review 65(2): 256-278.
14. Discouraged Workers
Discouraged workers are persons not currently looking for work because they believe that there are no jobs available for them. The number of discouraged workers in the U.S. increased sharply during the current recession, rising to 717,000 in the first quarter of 2009, a 70-percent increase from the first quarter of 2008. Relative to their share of the labor force, young people, blacks, and, to a lesser extent, Hispanics and men were over-represented among discouraged workers.
Unemployed and marginally attached workers in first quarter of 2009 (as share of the civilian population)
Source: U.S. Department of Labor, Bureau of Labor Statistics. 2009. Ranks of Discouraged Workers and Others Marginally Attached to the Labor Force Rise During Recession. See http://www.bls.gov/opub/ils/pdf/opbils74.pdf.
15. Wealth Inequality
The ownership of wealth among households in the U.S. became somewhat more concentrated since the 1980s. The top 10% of households controlled 68.2 percent of the total wealth in 1983 and 73.1% of the total wealth in 2007.
Concentration of wealth in the U.S. between 1983 and 2007

Source: Source: Edward N. Wolff, 2010. “Recent Trends in Household Wealth in the United States: Rising Debt and the Middle-Class Squeeze – An Update to 2007.” Levy Economics Institute Working Paper No. 589. Annandale-on-Hudson, NY: Levy Economics Institute.
16. Intergenerational Income Mobility
Intergenerational income mobility can be measured by calculating the rate at which individuals move to income quintiles that are different that that of their families of origin. The proportion of sons who remained in the bottom quartile declined between 1961 and 1972 and stayed the same afterward.
Family Background and Income in Adulthood (individuals age 30 to 59)
Source: Harding, David, Christopher Jencks, Leonard M. Lopoo, and Susan E. Mayer. 2008. “Family Background and Incomes in Adulthood.” Pp. 505-515 in Social Stratification: Class, Race and Gender in Sociological Perspective, edited by David B. Grusky. Boulder, CO: Westview Press.
17. Deregulation of the Labor Market
The percentage of all wage and salary workers who are union members has declined from 24% in 1973 to 12.4% in 2008. The decline in the private sector was steeper than the decline in the public sector. At the same time as union membership declined, the real value of the minimum wage also fell by 25% in the 1980s, leading to a weakening influence of the minimum wage on the low-wage labor market. These two developments in combination may be understood as the foundation of the newly “deregulated” U.S. labor market.
Private-sector union membership and real minimum wage, 1973-2008

Source: Barry T. Hirsch and David A. Macpherson. Union Membership and Coverage Database from the CPS. See http://www.unionstats.com; http://www.census.gov/compendia/statab/cats/labor_force_employment_earni…
18. Job Losses
Employment fell by 3.1 million jobs during 2008, and by another 4.7 million jobs in 2009. The job losses in the 2007-09 recession are more severe than in all prior recessions.
Job losses in recent recessions, changes in total employment from beginning of recession
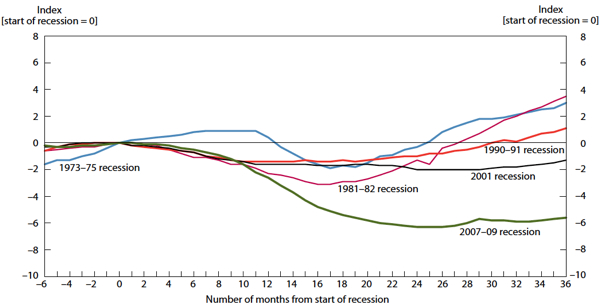
Source: Christopher J. Goodman and Steven M. Mance. 2011. Employment Loss and the 2007-09 Recession: An Overview. Monthly Labor Review. See: http://www.bls.gov/opub/mlr/2011/04/art1full.pdf
19. Immigrants and Inequality
Does immigration to the U.S. bring highly-skilled workers into the labor force or unskilled workers? The answer is both! The education distribution below indicates that immigrants are concentrated in both tails of the skill distribution.
Characteristics of immigrant education enrollment in 2000
Source: David Card. 2009. Immigration and Inequality. Center for research and analysis of immigration. See http://eprints.ucl.ac.uk/14325/1/14325.pdf
20. Incarceration
The incarceration rate in the United States has grown so dramatically since the 1970s that the U.S. now has one of the highest rates in the world. The rise in incarceration has been especially prominent among young Black males and high school dropouts. As shown in this graph, a full 37% of those who are both young black males and high school dropouts are now in prison or jail, a rate that’s more than three times higher than what prevailed in 1980.
Percent of 20-34 year old men in prison or jail, by race, ethnicity, and educational attainment, 1980 and 2008
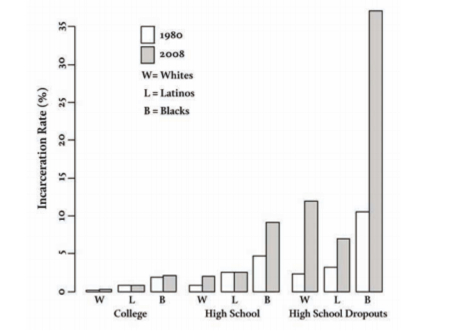
Source: Western, Bruce & Becky Pettit (2010). Incarceration and Social Inequality. Daedalus, 139(3), 8-19
Source: https://www.youtube.com/channel/UCQ1Ll1ylCg8U19AhNl-NoTg and SUPPORTING US where you can: Award Winning Independent Citizen Media Needs Your Help. PLEASE SUPPORT US FOR JUST £2 A MONTH https://dorseteye.com/donate/


