
This article is a dedicated analysis of the Tory years 2010 to 2018. It reflects the key elements of socio policy fully supported by multiple references.
It makes for depressing reading but more important hopefully a revelatory experience for those who have not delved too closely until now.
The 8 Year Challenge:
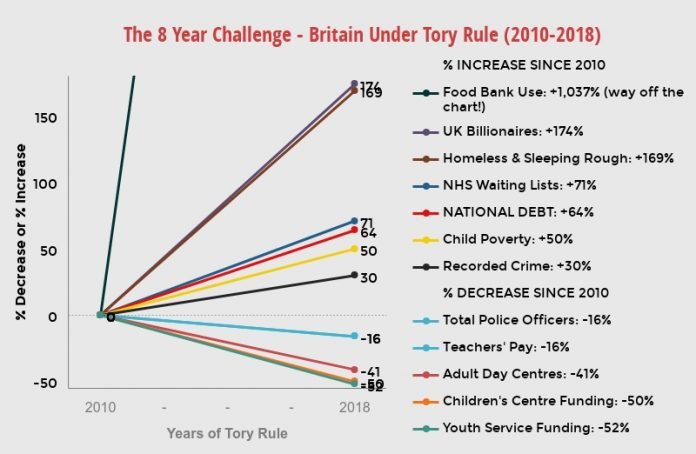
The Facts Behind The Chart:
INCREASED:
FOOD BANK USAGE – 1,370% INCREASE
The Trussell Trust is the largest food bank network in the UK. In 2009/10, it handed out around 41,000 food packs to approx 20,000 people. In 2017/18, it handed out over 1.3 million packs to an estimated 590,000 different people. 484,026 of these packs were to benefit children. Food Bank use has therefore increased by 1,370% since 2010.
The Trust accounts for approx two-thirds of UK food banks. Therefore, total UK Food Banks in 2017-18 gave out approx 2 million packs to 900,000 people. The number one reason given for people using food banks was not unemployment or benefit delays/sanctions (though these were common reasons), it was low wages – y’know, like nurses!
In areas where Universal Credit had been implemented for over a year, food bank usage had increased 52% in the 2017-18 year! In other areas, the increase was 13%. In other words, areas with an established system of Universal Credit had a 4 times higher increase in food bank use.
It is now estimated that 3.7 Million (1 in every 14) adults in the UK have had to use a food bank.
A report by the Joseph Rowntree Foundation shows more than 1.5 million people were classed as ‘destitute’ in the UK in 2017 – more than the populations of Liverpool and Birmingham combined.
UK BILLIONAIRES – 174% INCREASE
2010 UK Billionaires – 53
2018 UK Billionaires – 145 (up 174%)
HOMELESS & SLEEPING ROUGH – 169% INCREASE
November 2018 Shelter Report – 320,000 recorded as homeless (1 in every 200 people).
The number of rough sleepers (including ex-Service personnel) has increased 169% since 2010! In other words, for every 1 person that was sleeping rough in 2010, there are now 2.69!
Labour halved the number of households (families) registered as homeless from over 100,000 in 1997 to 49,000 in 2010. This has since increased by 80% and is now over 79,880 (as of March 2018) and rising!
In 2018, there are more than 123,000 children living in temporary accommodation including bed and breakfast rooms and hostels. This is a 65% increase from 2010!
NHS WAITING LISTS – 71% INCREASE
Waiting lists fell to a low of 2.4 million in 2009/10 (at the end of the Labour government), but have climbed since and stood at 4.11 million as of June 2018. This is an overall increase of 71% since June 2010.
The number of patients dying while waiting for treatment has increased by well over 10,000 in five years – from 18,876 in 2012/13 to 29,553 in 2017/18. But this number will actually be higher (approx double), as only half (67 of 135) of the NHS Trusts responded to the Freedom of Information Act request!
Some specialist treatment has been the worst affected, with patients awaiting treatment for lung diseases – the UK’s third biggest killer – up by 128% since September 2011 to almost 100,000.
The Government continues to miss its own targets, including for ‘treating or assessing 95% of people within four hours at A&E’, ‘the 18 week maximum for non-urgent operations’ and ‘85% of people diagnosed with cancer should wait no more than 62 days before the start of treatment.’ These targets have not been met for several years!
In January 2018, in an unprecedented move, doctors and consultants from 68 A&E units in England and Wales wrote to Theresa May stating, amongst other things, that 120 patients a day were being managed in hospital corridors and that some were dying prematurely! An utter disgrace!
Two years ago, the Government removed the training bursary for nurses. Nursing applications have since dropped by a third – whilst there are 40,000 unfilled nursing vacancies.
NATIONAL DEBT – 64% INCREASE
Yes, you read it right!! Forget the Tories claims to be the party to trust with the economy and that they are reducing our national debt! Here are the facts…..
As of March 2010, UK Government debt was £1.07 Trillion (or 70.3% of GDP).
As of March 2018, UK Government debt was £1.76 Trillion (or 85.8% of total GDP).
Since 2010, our Government (national) debt has risen by £690 Billion or 64%.
As a percentage of GDP, our national debt has risen by 15.5%.
This is all whilst inflicting horrific austerity measures on the population and massively cutting OUR public services!
Incidentally, for the first 10 years of the Labour Government, the national debt went from 43.8% of GDP in 1996-7 to 33.8% (in 2003-4) to 40.9% in 2008. It stayed below the previous debt level for over 10 years! Then the global banking collapse happened in 2008 and the global recession. Our national debt increased (as it did with countries across the world), in large part due to the enormous cost of bailing out the banks.
In case you missed it, the national debt has INCREASED by 64% under the Tories!
CHILD POVERTY – 50% INCREASE
2018 – 4.1 million children are now in ‘relative poverty.’ That’s 30% of Children! OUR children! That’s an increase of 50% since 2010! That’s 9 children in every class of 30!
This includes 3.1 million children of working parents (this has almost doubled from 2.1 million in 2010). Child poverty is now over 50% in some inner-city areas.
Under Labour (1997-2010)
In 1997/8 – Relative Poverty = 27% and rising (shockingly, this had more than doubled from 13% under the previous Tory government of Thatcher/Major).
In 2009/10 – Relative Poverty = 20% (and falling)
From 1997-2010 under Labour, some 900,000 children were lifted out of relative poverty (before housing costs are included. After housing costs are included it was 800,000).
In 1997/8 – Absolute Poverty = 26.1% (and rising)
In 2009/10 – Absolute Poverty = 12.4% (and going down)
From 1997-2010 under Labour, some 1.8 Million children were lifted from absolute poverty.
Just as a by-the-by, Pensioner Poverty was slashed under Labour too!
Under Conservatives (2010-2018)
In 2018 – Relative Poverty = 30% (4.1 million children, a 50% increase) and rising.
In 2018 – Absolute Poverty = Take a guess on the real figure! The UK as a whole has been left without an official measure of poverty since the Conservative government’s scrapping of Labour’s child poverty targets!
The Institute for Fiscal Studies estimates that relative child poverty will increase further to 37% by 2022 and puts this increase down “mainly to the effect of tax and benefit reforms introduced by the government.”
RECORDED CRIME – 30% INCREASE
(These figures are for England & Wales):
2009/10 Police Recorded Crime – 4.3 million
2017/18 Police Recorded Crime – 5.6 million (up 30%)
In 8 years: From June 2010 to March 2018, homicides are up 14%, Sexual Offences are up 80% and Knife Crime is up 20%.
Recent Crime Statistics
In one year from April 2017 to March 2018, there was a:
12% increase in homicides
0.8% increase in sexual offences
16% increase in offences involving knives
30% increase in robberies
8% increase in thefts
36% increase in public order offences
Year ending June 2010: knife 33,566, homicide 615, sexual offences: victims were approx 1.5% of population
Year ending March 2018: knife 40,147 (up 19.6%), homicide 701 (up 14%), sexual offences: victims were approx 2.7% of population (up 80%)
DECREASED
POLICE OFFICERS – 23,000 LESS OFFICERS or 16% DECREASE
The number of police officers in England and Wales has fallen by 23,000 between March 2010 and March 2018. This is a reduction of 16%.
From 1997 to 2010, Labour increased Police Officers from 125,000 to 144,000 (as of March 2010).
Since 2010, the Conservatives have reduced the number to 122,000 (as of March 2018).
TEACHERS’ PAY – 16% REAL TERMS PAY CUT
Teachers had a real terms pay cut of 16% from 2010 to 2017. Teachers’ pay increased by approx 5-6% from 2010 to 2017 while the Retail Price Index increased 21.9%.
Analysis of Government figures in September 2017 found that teachers were an average of more than £5,000 a year worse off in real terms than in 2010.
ADULT/ELDERLY DAY CENTRES – 428 CENTRES CLOSED (41% CUT)
Between 2010 and 2018, 428 Day Centres have closed – a 41% cut.
CHILDREN’S CENTRES (for Under-5’s) – 1,034 CENTRES CLOSED (50% CUT IN FUNDING)
Between 2010 and 2018, 508 Children’s Centres have officially closed (according to government figures) and Children’s Centre funding has been slashed by 50%.
However, a report by the Sutton Trust showed that the real number of Children’s Centres closed between 2009 and 2017 was 1,034 (double the official government number!)
YOUTH CLUBS – 1,000 CLUBS CLOSED (52% CUT IN FUNDING)
Between 2012 and 2018, 760 youth centres have closed and 4,500 youth work jobs were cut. Since 2010, it is estimated that over 1,000 youth centres have closed.
Youth Service funding has been slashed by 52% (from 2010 to 2018).
Tom Lane
SOURCES
Please note that all figures were obtained from reputable sources, including the Government’s own statistics (including from gov.uk) and the Office for National Statistics.
Here are some of the sources of information/facts (and some really interesting articles):
Food Banks:
https://www.trusselltrust.org/
UK Billionaires:
https://www.thesun.co.uk/news/6274823/unday-times-rich-list-2018-uk-billionaire-self-made/
(OK, The Sun is not a ‘reputable’ source, but I didn’t want to register online in order to view The Times and this was the only 2018 source I could find that quotes the Times figures for Billionaires (other than Google!)
Homelessness:
https://www.gov.uk/government/statistics/statutory-homelessness-in-england-april-to-june-2018
https://researchbriefings.parliament.uk/ResearchBriefing/Summary/SN02110
NHS waiting Lists:
https://www.bbc.co.uk/news/health-42943232
https://www.rcn.org.uk/news-and-events/news/removing-the-student-nurse-bursary-has-been-a-disaster
https://www.kingsfund.org.uk/publications/how-nhs-performing-june-2018
National Debt:
(includes 2010 figures)
https://www.ukpublicspending.co.uk/uk_national_debt_analysis
Child Poverty:
https://www.ifs.org.uk/wps/wp1023.pdf
https://www.ifs.org.uk/publications/6738
http://www.cpag.org.uk/content/child-poverty-facts-and-figures
https://www.theguardian.com/society/2015/jul/01/tories-redefined-child-poverty-no-longer-finances
Recorded Crime:
https://www.ons.gov.uk/releases/crimeinenglandandwalesyearendingmarch2018
Police Officers:
https://fullfact.org/crime/police-numbers/
Teachers’ Pay:
https://www.teachers.org.uk/edufacts/teachers-pay
https://www.unison.org.uk/…/Pay-claims-outline-of-economic-background_LatestVersion.docx
https://www.nasuwt.org.uk/uploads/assets/uploaded/52a326e1-c765-4c8c-b2b705d0b7a7ca83.pdf
Adult/Elderly Day Centres:
Children’s Centres:
https://www.cypnow.co.uk/cyp/news/2005120/as-many-as-1-000-childrens-centres-now-closed-study-finds
Youth Clubs:
https://www.cypnow.co.uk/cyp/news/1158579/youth-services-cut-by-gbp387m-in-six-years
https://www.unison.org.uk/content/uploads/2016/08/23996.pdf
https://www.unison.org.uk/content/uploads/2016/08/23996.pdf
https://www.theguardian.com/society/2016/aug/10/teenagers-isolated-idle-youth-clubs-services-closed
https://www.theguardian.com/society/2018/oct/31/youth-work-cuts-young-people-councils


